Make a plot
This page imports and runs an m-file that makes a plot.
This is the input:
x = linspace(0,2*pi);
y = cos(x);

disp('about to plot');
plot(x,y);
disp('about to save');
saveas(gcf,'sandbox_plot.png');
disp('saved');
This page is located at matlab/sandbox/plot.md.
This is the text output
about to plot
about to save
saved
This is the image output:
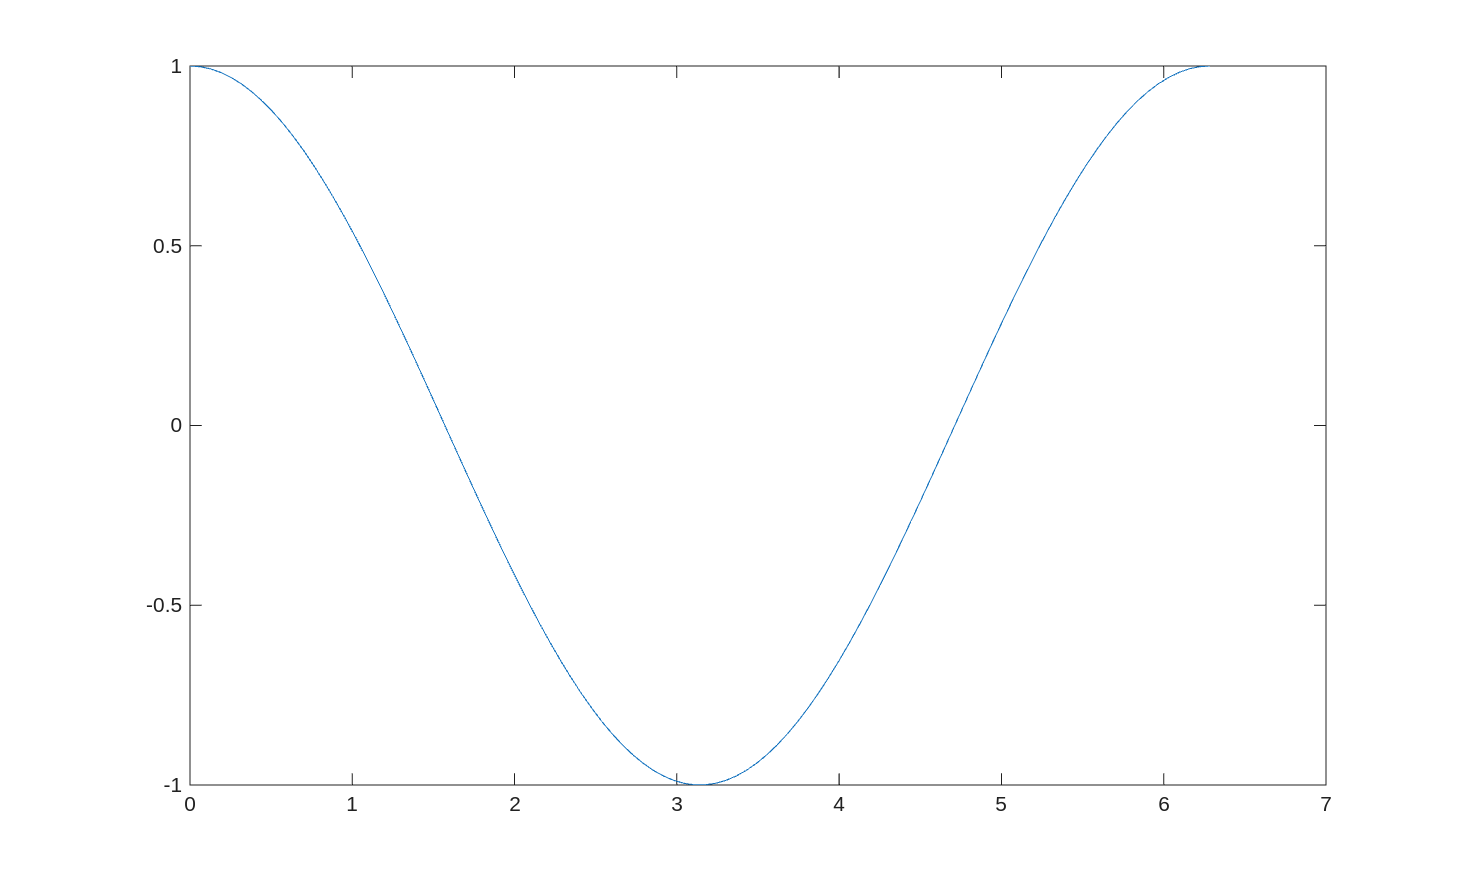
image link: https://kip-hart.github.io/SiteSandbox/assets/images/figures/matlab/sandbox_plot/Figure_1.png.