Random Numbers
In engineering, we often work with uncertain quantities. What will the wind speed be on the day of the rocket launch? Where are the obstacles my robot needs to avoid? How do I handle the % error from the results of my experiment?
Random (and pseudorandom) numbers can be created and used in MATLAB when working with uncertain quantities.
Pseudorandom Numbers
Modern computers are machines, fundamentally, that cannot create mathematically random numbers. Quantum computers are the exception, containing qubits that exhibit wave-particle duality. For our purposes, a “classical” modern computer produces the same results every time a code is run because the source code and the inputs remain the same.
MATLAB can generate pseudorandom numbers that meet our needs, as engineers, for random numbers without fitting the mathematical definition of a random number. It follows the Mersenne Twister algorithm to generate draws of a random number distribution, in a repeatable way. The first draw is always the same, the second is always the same, and so on. To generate a different list of draws, the twister algorithm can be initialized with a different seed value.
The fact that a pseudorandom number generator outputs the same set of draws each time the MATLAB script runs is an overall benefit in engineering. If you are designing an aircraft, for example, and it loses control on the first draw of the random winds profile, then you want that draw to remain the same while you try to improve the design. If the draws changed every time, you would lose the ability to troubleshoot the design in that wind condition.
MATLAB Functions
Initializing
To initialize the random number generator (RNG) within MATLAB, use the rng function.
Its syntax is rng(seed), where seed is a nonnegative integer.
You can also use rng("default") to use MATLAB’s default seed.
Without any input, rng will print out the current RNG settings.
rng(0)         % seed RNG with 0
rng("default") % MATLAB's default seed
rng            % print RNG settings
ans =

  struct with fields:

     Type: 'twister'
     Seed: 0
    State: [625×1 uint32]
The MATLAB Help Center has documentation on rng.
Uniform Distributions
To draw numbers from a uniform distribution in MATLAB, use the rand function.
This will always draw numbers from 0 to 1, so to go from $a$ to $b$ you can scale and shift the outputs:
The syntax for rand is rand(m, n), which creates a matrix with m rows and n columns of random numbers from 0 to 1.
There is a shortcut, rand(n), which generates an square matrix with n rows and columns.
This can be confusing for new users, who may expect rand(n) to generate row vector with n elements.
Examples of drawing from a uniform distribution are:
% Uniform random numbers
rng(0)
disp('RNG seed = 0')
x = rand(1, 5)  % x ~ U[0, 1]
y = -10 + 20*x  % y ~ U[-10, 10]

% Draws with new seed
rng(1)
disp('RNG seed = 1')
x = rand(1, 5)

% Draws with first seed
rng(0)
disp('RNG seed = 0')
x = rand(1, 5)
RNG seed = 0

x =

    0.8147    0.9058    0.1270    0.9134    0.6324


y =

    6.2945    8.1158   -7.4603    8.2675    2.6472

RNG seed = 1

x =

    0.4170    0.7203    0.0001    0.3023    0.1468

RNG seed = 0

x =

    0.8147    0.9058    0.1270    0.9134    0.6324
The above example draws uniform random floating point numbers, but sometimes we need to draw random integers.
To do that, we use the randi function.
Its syntax is randi(imax, m, n), where imax is the maximum integer.
The minimum integer is always 1.
For example:
% Random Integers
rng(0)

UIDs = [123, 098, 567, 321];
idx = randi(4)
lucky_student = UIDs(idx)

% List of random integers
idx_max = 100;
ints = randi(idx_max, 10, 1)
idx =

     4


lucky_student =

   321


ints =

    91
    13
    92
    64
    10
    28
    55
    96
    97
    16
The MATLAB Help Center has documentation on rand and randi.
Normal Distributions
To generate draws from the standard normal distribution (mean of 0 and standard deviation of 1), use the randn function.
Its syntax is randn(m, n), where m is the number of rows and n is the number of columns in the output.
Since these are draws from the standard normal, you need to scale and offset the values for a specific mean and standard deviation:
For example:
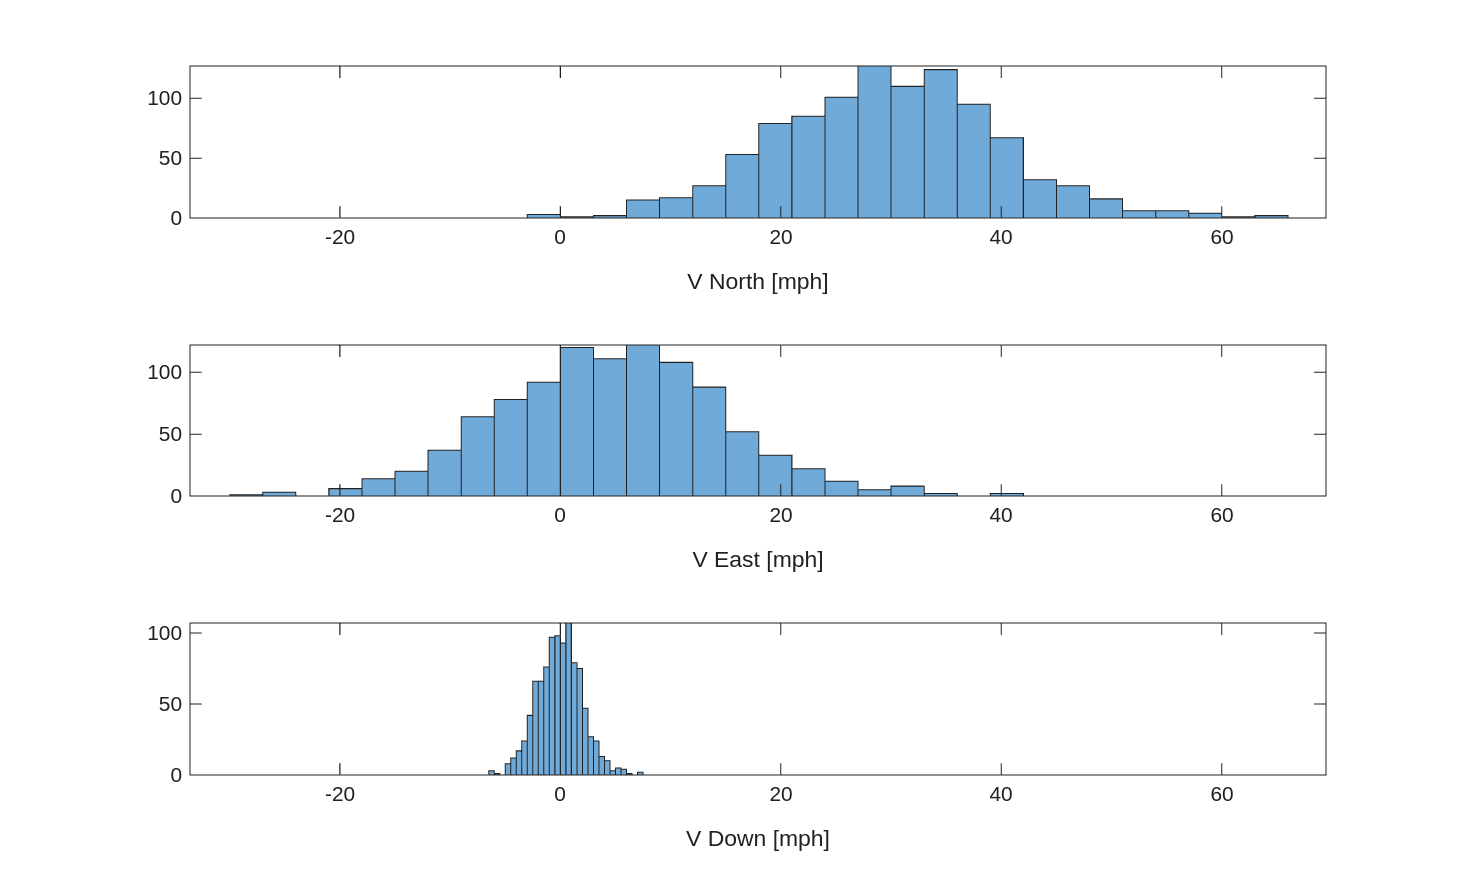
% Normal Distribution
wind_mean = [30, 5, 0];   % mph
wind_stdev = [10, 10, 2]; % mph

rng(0)
wind_draws = wind_mean + randn(1000, 1)*wind_stdev;


% Plot winds
tiledlayout(3,1);

ax1 = nexttile;
histogram(wind_draws(:, 1))
xlabel('V North [mph]')

ax2 = nexttile;
histogram(wind_draws(:, 2))
xlabel('V East [mph]')

% Acceleration
ax3 = nexttile;
histogram(wind_draws(:, 3))
xlabel('V Down [mph]')

% Link axes
linkaxes([ax1, ax2, ax3], 'x')
The MATLAB Help Center has documentation on randn.
Custom Distributions
While uniform and normal distributions are most commonly used, MATLAB provides the random function to sample other distributions.
This includes binomial distributions, exponentials, Weibulls, Poissons, Betas, and T distributions.
The syntax for this function is random(name, A, m, n), where name is the name of the distribution, A is its parameter, m is the number of rows in the output, and n is the number of columns.
If the distribution has more than one parameter, add those after A.
For example:
x = random('Poisson', 5, 10, 1);
The MATLAB Help Center has documentation on random.
Statistics
After generating and working with samples from distributions, you may need to calculate statistics on the results of those calculations. These are common MATLAB functions that you may need for calculating statistics on results:
| Function | Description | Syntax |
|---|---|---|
| mean | Compute the arithmetic mean | mean(X) |
| median | Compute the median | median(X) |
| mode | Find the most frequent value | mode(X) |
| var | Compute variance | var(X) |
| std | Compute standard deviation | std(X) |
| histogram | Plot a histogram of data | histogram(X,nbins) |
| quantile | Compute p-quantiles (p in [0,1]) | quantile(X,p) |
| prctile | Compute rth percentiles (r in [0,100]) | prctile(X,r) |
Engineering Applications
While most problem solving in engineering school works with exact values, in practice there are many cases of uncertain values. There are epistemic uncertainties, that relate to measurement accuracy and lack of information, and generally can be reduced by spending more time or money. For example, a back-of-the-envelope estimate of the performance of an engine is going to be more uncertain than building and testing it in a laboratory. Other uncertainties cannot be reduced, no matter how much time or money is spent, and are called aleatory uncertainties. Random natural processes, like the weather, sunspot activity, sea states on the ocean, are all examples of aleatory uncertainty. There are forecasts, but not actual knowledge of the weather in the future. Another example of aleatory uncertainty is us, humans. If you design a product for humans to use, there is variation in human anatomy that cannot be reduced by spending time and money.
Other than physical constants, like the universal gas constant or the speed of light, almost all values we use in engineering have some uncertainty associated with them. Consider the cannonball problem as an example. It launches at some initial velocity, but how do we know what that velocity is? Are we estimating from a simulation of the cannon? Are we using measurements from past cannon firings? And how do we know the initial position of the cannon? Are we using a map of the terrain? Are we using GPS? Do we have a survey of the area? How we answer these questions produces different levels of uncertainty in those values for our simple cannonball problem, which changes the range of possible trajectories. For more complicated engineering systems, there are uncertainties in whether that system will perform expectedly, as well as cost and schedule uncertainties.
Examples
Example: Lunar Lander
Question
At a lunar base, a rocket lands nearby and kicks up lunar soil (regolith) as the exhaust blasts the surface. The regolith particles are initially at ground level, altitude=0, and are accelerated to some uncertain velocity by the exhaust. The velocity angle is uniformly distributed from 0 to 5 degrees above the ground. The velocity magnitude is normally distributed with a mean of 300 m/s and a standard deviation of 10 m/s. Any particles that hit the ground more than 10 kilometers away from the landing site will strike the base. The surface gravity on the moon is 1.62 m/s2.
Determine the percent of regolith particles that will strike the base, using 8000 samples of the uncertain parameters and an RNG seed of 2. Of the particles that will strike the base, what is the average speed ($\sqrt{v_h^2+v_v^2}$) in m/s of those particles?
Solution
To solve this problem, we first create lists of samples of the uncertain values.
Using element-wise operations, we calculate the final states of all the particles simultaneously.
From there, we create a logical mask to determine which particles went far enough to strike the base.
We then find the average speed of that subset using the mean function and picking only the samples that strike the base.
%% Givens
% MKS units + radians
h0 = 0;

theta_lower = deg2rad(0);
theta_upper = deg2rad(5);

v_mean = 300;
v_std  = 10;

x_base = 10000;

g = 1.62;

n_samples = 8000;
seed = 2;

%% Final Speed and Position

% Sample uncertain values
rng(seed);
theta_samples = theta_lower + (theta_upper - theta_lower) * rand(n_samples, 1);
v_samples = v_mean + v_std*randn(n_samples, 1);

% Calculate final speed
v_h = v_samples .* cos(theta_samples);
v_v0 = v_samples .* sin(theta_samples);
v_vf = -v_v0; % parabola, symmetric
speed_final = sqrt(v_h.^2 + v_vf.^2);

% Calculate final position
tf = (v_v0 - v_vf)/g;
dx = v_h .* tf;

%% Particles Striking the Base

% Fraction striking base
mask = dx >= x_base;
n_strike = sum(mask);
frac_strike = n_strike / n_samples;
percent_strike = 100*frac_strike

% Speed of particles striking base
speed_striking = speed_final(mask);
avg_speed = mean(speed_striking)
percent_strike =

    1.0375


avg_speed =

  315.4905
Reading Questions
- Do classical computers produce truly random numbers, pseudorandom numbers, or both?
- What algorithm does MATLAB use to generate pseudorandom numbers?
- How do you initialize MATLAB’s random number generator to a specific seed?
- How do you draw a 3x5 matrix of uniform random numbers between 0 and 1?
- How do draw uniform random numbers from $a$ to $b$?
- What is the difference between
randandrandi? - How do you generate 500 samples from a normal distribution with $\mu$=10 and $\sigma$=2?
- How would you draw 500 samples from two independent standard normal distributions?
- How do you find the 95th percentile of a list of uncertain values?