Scatter Plot
import numpy as np
import matplotlib.pyplot as plt

t = np.linspace(0, 10, 50)
altitude = 1000 * np.sin(0.3 * t) + 2000
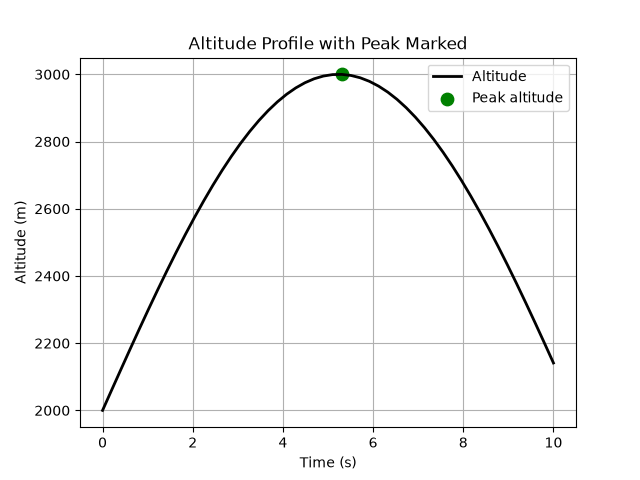
idx_peak = np.argmax(altitude)

plt.figure()
plt.plot(t, altitude, "k-", linewidth=2, label="Altitude")
plt.scatter(t[idx_peak], altitude[idx_peak], color="green", marker="o", s=80, label="Peak altitude")
plt.xlabel("Time (s)")
plt.ylabel("Altitude (m)")
plt.title("Altitude Profile with Peak Marked")
plt.legend()
plt.grid(True)
plt.show()