Basic Line Plot
import numpy as np
import matplotlib.pyplot as plt

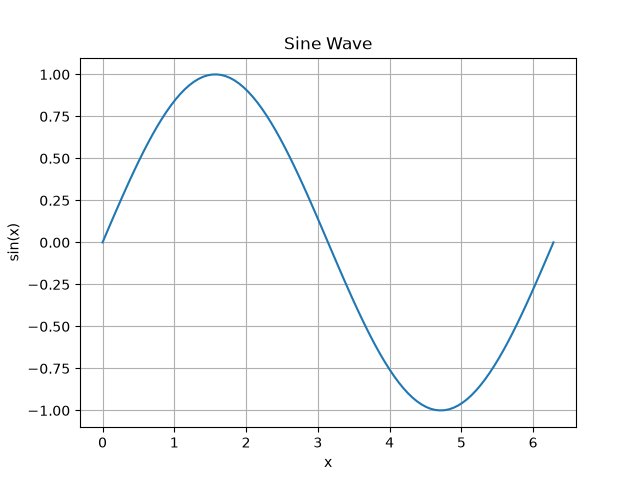
x = np.linspace(0, 2 * np.pi, 100)
y = np.sin(x)

plt.figure()
plt.plot(x, y)
plt.xlabel("x")
plt.ylabel("sin(x)")
plt.title("Sine Wave")
plt.grid(True)
plt.show()
import numpy as np
import matplotlib.pyplot as plt
x = np.linspace(0, 2 * np.pi, 100)
y = np.sin(x)
plt.figure()
plt.plot(x, y)
plt.xlabel("x")
plt.ylabel("sin(x)")
plt.title("Sine Wave")
plt.grid(True)
plt.show()